SmartVision
SmartVision transforms raw asset data into actionable intelligence. By tracking performance, usage patterns, cost implications, and compliance metrics, this module empowers decision-makers with deep insights that drive operational efficiency and strategic planning. Through customizable dashboards and visual reports, organizations can easily identify underperforming assets, measure ROI, and ensure compliance with internal policies and external regulations.


Predictive Insights & AI Forecasting
This feature uses machine learning and trend analysis to detect inefficiencies, predict maintenance needs, and support strategic planning. It empowers your organization to act before problems arise.
- AI-driven predictions for asset failure and lifecycle end
- Machine learning models based on usage, maintenance, and condition data
- Trend analysis for budgeting and resource planning
- Forecast future utilization and cost impact
- Early warnings and anomaly detection via automated alerts
Cost Analysis
Gain full visibility into the total cost of ownership and operational expenses of each asset. This feature consolidates financial data to support smarter budgeting and procurement decisions.
- Calculate total cost of ownership (TCO) including purchase, maintenance, and downtime
- Break down costs by asset, location, department, or vendor
- Analyze asset depreciation and financial impact over time
- Identify cost-saving opportunities through repair vs. replace analysis
- Integrate with accounting systems for real-time cost syncing
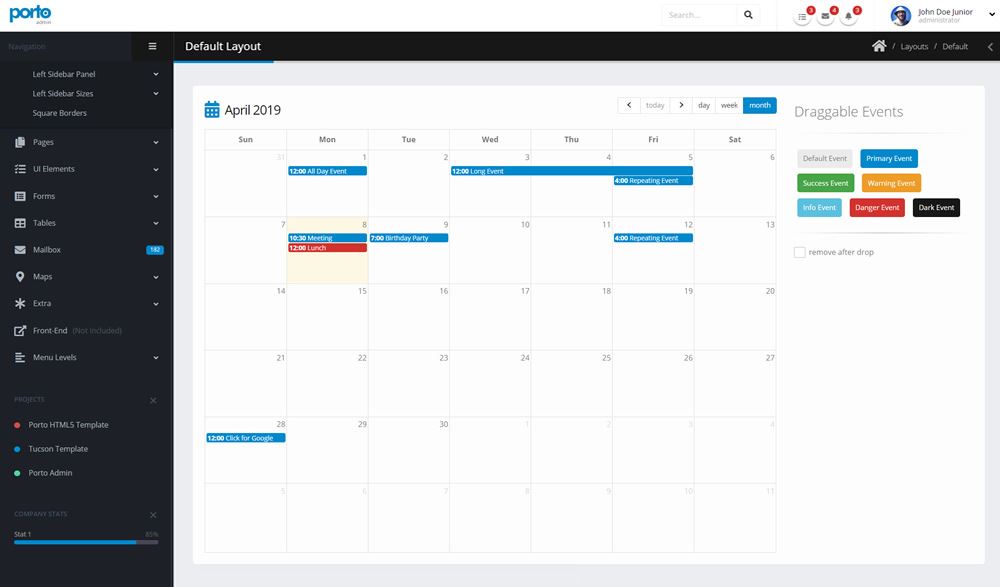
Compliance Tracking
Stay audit-ready and ensure your assets comply with safety standards, maintenance schedules, and regulatory requirements. This feature centralizes compliance data and automates alerts.
- Track certifications, inspections, and license expiration dates
- Automated reminders for regulatory compliance events
- Log non-compliance incidents with corrective actions
- Attach compliance documentation to each asset
- Generate audit-ready reports with date/time/user stamps
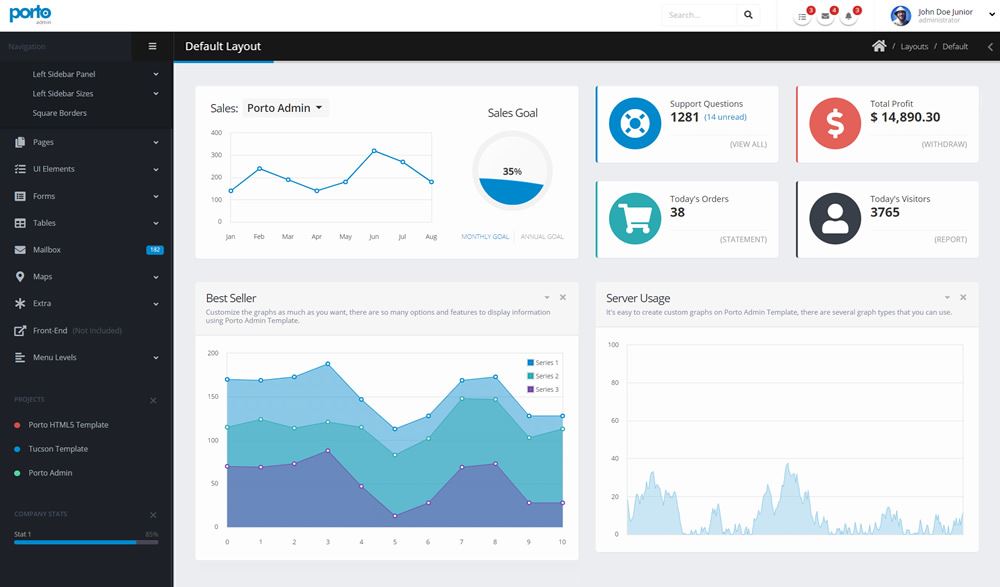
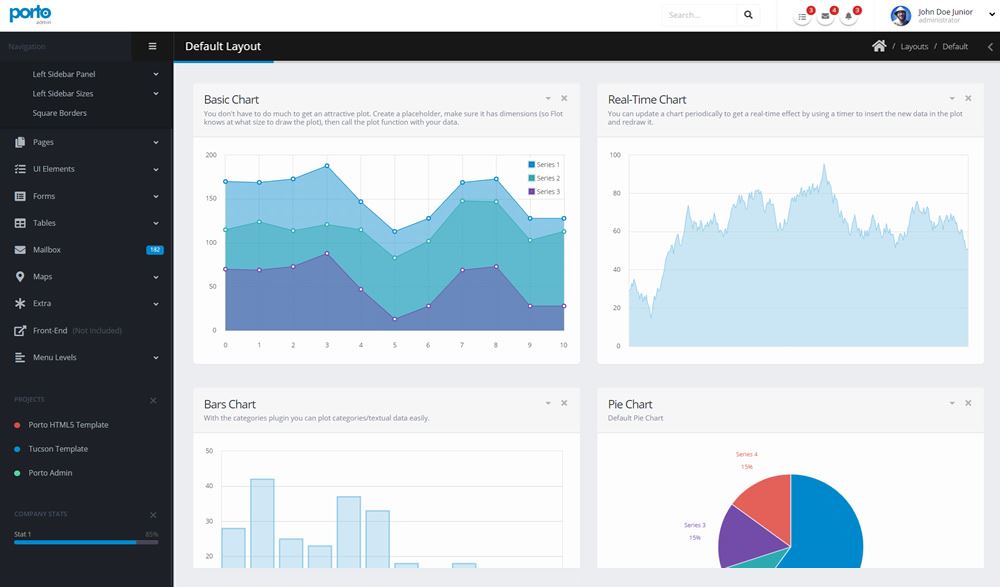
Custom Dashboards
Every organization measures success differently. This feature lets users create custom visual dashboards that highlight the metrics and KPIs most important to them.
- Drag-and-drop dashboard builder with real-time data
- Choose from charts, graphs, tables, and KPI widgets
- Configure dashboards by role, department, or user
- Export or schedule dashboard snapshots via email
- Mobile-responsive views for monitoring on the go
Tech Stack & Compatibility
SmartVision uses a modern analytics engine and is designed for scalability and data security. It supports integration with data lakes, BI tools, and enterprise resource planning (ERP) systems.
- Built-in analytics engine using real-time data pipelines
- REST and GraphQL APIs for external integrations
- Compatible with BI platforms like Power BI, Tableau, and Looker
- Secure data access control by user role and asset category
- Cloud-first, scalable, and GDPR-compliant architecture
Utilization Reports
Understand asset usage across departments, teams, and time periods. These reports reveal how assets contribute to productivity and where improvements can be made.
- Track how often and how long assets are used
- Identify idle or underutilized assets
- Compare actual vs. expected usage by asset or asset type
- Generate asset efficiency scores and benchmarks
- Usage trends over time, filtered by department or location
Track your Assets like a Pro
Easy Implementation | Highly scalable | No additional infrastructure
Start Free Trial Now - 30 Days
Reach out for a demo and get started with AssetVision.